The Green Volume Trap: What Retail Traders Get Wrong About Iceberg Orders and Market Manipulation
A giant green volume bar does not mean buyers are in control. It means a lot traded. The harder question is what was real, what was hidden, what was forced, and what—if anything—was deceptive.
Antonio T Smith Jr, Founder, Density6 · August 31, 2026 · 62 min read
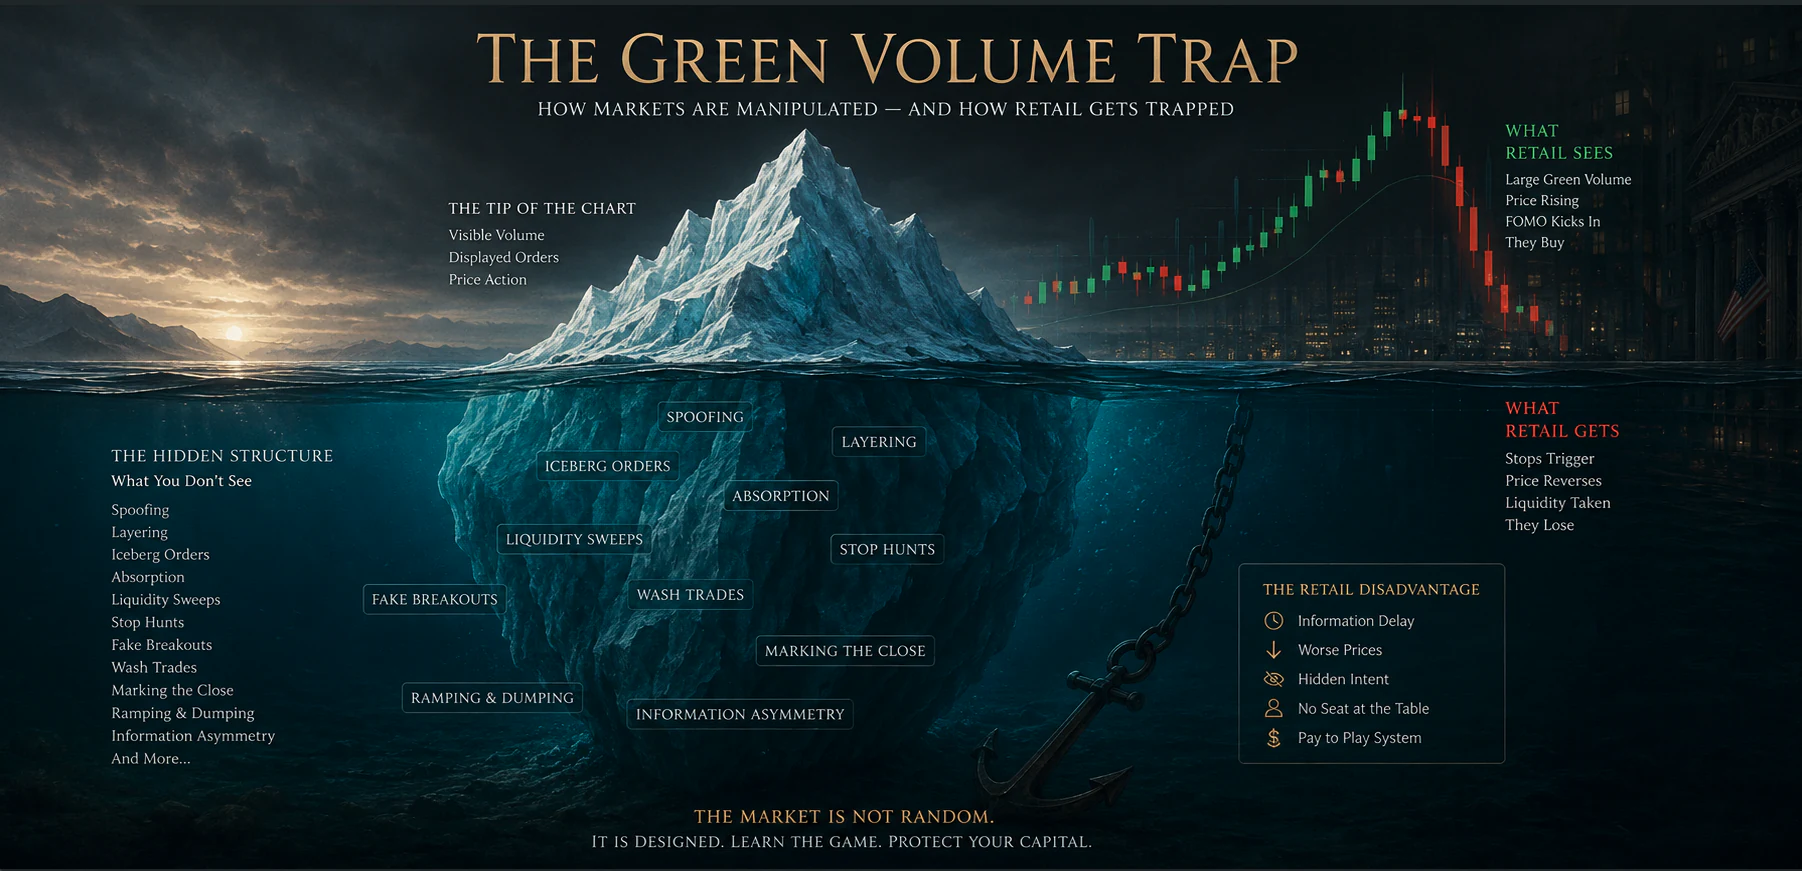
Educational purpose: This article explains market structure, trading behavior, fraud and manipulation risk. It is not individualized investment advice, and no chart pattern by itself proves that any person or firm broke the law.
The Answer: A Green Volume Bar Is Not a Verdict
A large green volume bar is not proof that “buyers won,” that institutions are accumulating, or that an iceberg order is manipulating the market. In futures, every executed contract has a buyer and a seller. CME Group states plainly that volume cannot tell you whether traders are buying or selling, opening or closing positions.[^cme-volume] On TradingView, one common volume calculation explicitly classifies up and down volume from price direction inside the bar rather than from the identity or conviction of the participants.[^tradingview-volume]
That means the color is often a visual classification, not a measurement of who is stronger.
Iceberg orders make the problem more interesting, not simpler. CME supports Displayed Quantity orders, historically called iceberg orders, that show only part of the real order in the book.[^cme-displayed] Nasdaq supports non-displayed reserve liquidity in equities.[^nasdaq-reserve] These are legitimate market mechanisms. A genuine seller can sit behind a small displayed quantity and absorb a large amount of aggressive buying. The resulting bar may be green, the executed volume may be enormous, and the price may still fail to advance. Late retail buyers can be trapped even though nobody manipulated anything.
Actual manipulation is a different category. Spoofing and layering use non-bona fide orders or deceptive order patterns to create a false appearance of supply, demand, depth, pressure or price movement. The CFTC defines spoofing around the intent to cancel before execution and expressly distinguishes legitimate, good-faith cancellations from spoofing.[^cftc-spoofing-guidance] FINRA’s surveillance framework separately identifies layering, spoofing, wash trades, prearranged trades, marking the close and odd-lot manipulation.[^finra-2026] The first discipline, then, is not learning to shout “manipulation” faster. It is learning to separate four things that retail traders constantly collapse into one:
What you see What it can establish What it cannot establish by itself A giant green volume bar A large amount of activity occurred during an up-classified bar or price interval That there were “more buyers than sellers,” that institutions were accumulating, or that the move must continue Repeated executions at one price A lot of volume traded at that level Whether one iceberg, many independent limit orders, a market maker, a hedger or another participant supplied the liquidity A large visible order-book wall Displayed interest existed at that moment That the order owner intended to let the order execute A wall that disappears The displayed order was cancelled or modified Why it was cancelled, whether the cancellation was legitimate, or whether it was spoofing Price sweeping an obvious high or low Trades occurred through that level That somebody deliberately “hunted” retail stops A sharp rally with exploding volume Price and activity accelerated together Whether the flow was fresh buying, short covering, forced liquidation elsewhere, rebalancing, news repricing, a pump, or manipulation A sharp reversal after huge green volume Aggressive buying failed to sustain higher prices Who sold into it, whether hidden liquidity was present, or whether any law was broken
A trader who understands that table has already escaped one of the most expensive retail myths: the chart is not the market. It is a rendering of selected market events. The deeper lesson is the Volume–Direction–Intent Separation Principle, an original Driftless News framework:
Volume measures executed activity. Price direction describes the outcome of an auction over an interval. Intent belongs to the participants. None of the three can be substituted for the other two.
That principle is the foundation for everything that follows.
What You Need to Know First
Retail traders are vulnerable when they treat partial information as complete information. A candlestick compresses thousands or millions of decisions into four prices. A volume bar compresses executed activity into a count. A visible order book shows only displayed orders available through the data being viewed. In stocks, the U.S. market is fragmented across exchanges and off-exchange venues. In a June 2026 Regulation NMS proposal, the SEC described 17 operating national securities exchanges trading NMS stocks and said off-exchange trading had, since late 2024, regularly exceeded half of overall volume; the same proposal documented rising execution against non-displayed liquidity even on exchanges.[^sec-reg-nms-2026]
Futures have a different architecture. A CME futures contract trades through CME Globex, which gives the trader a more centralized order book for that contract. Centralization does not mean total visibility. Displayed Quantity orders intentionally reveal only part of the full order.[^cme-displayed] The difference matters because “I can see Level II” or “I have the DOM” is not equivalent to “I can see the market.”
The retail trader is usually missing at least some combination of hidden quantity, off-exchange activity, participant identity, cross-market positions, inventory, hedges, routing logic, algorithmic intent and the historical pattern regulators can reconstruct across accounts and venues. A trader may infer. A regulator can subpoena, audit and compare.
That is why the strongest protection is epistemic discipline: know what the data proves, know what it merely suggests, and know what it cannot tell you.
Key findings
Green volume is not “buy volume.” Volume records executed activity. Every completed trade has both sides. Iceberg orders are not inherently manipulation. They are partially displayed genuine orders supported by major exchanges. Absorption can create the exact visual trap retail traders often call manipulation. Huge aggressive buying can meet equally strong resting selling and produce little net price progress. Spoofing and layering are different from icebergs. The defining issue is deceptive, non-bona fide displayed interest and intent, not hidden size. Manipulation is real and repeatedly prosecuted. The CFTC’s 2020 JPMorgan order involved hundreds of thousands of spoof orders and $920.2 million in monetary relief.[^cftc-jpmorgan] SEC cases filed in 2026 likewise alleged stock spoofing and small-lot price manipulation.[^sec-cerisano][^sec-patel] Retail cannot reliably prove intent from a single chart. Regulators look for patterns, account relationships, cancellations, opposite-side executions, cross-market positions and other evidence. The newest retail trap is often social rather than technical. FINRA says fraudulent investment groups increasingly steer victims into low-priced, low-volume exchange-listed stocks and can turn the victims’ coordinated buying into the price ramp that provides bad actors an exit.[^finra-investment-groups] The correct goal is not paranoia. The goal is to stop donating money to signals that never proved what you thought they proved.
Table of Contents
Why Does Green Volume Mislead Retail Traders? What Does Volume Actually Measure? What Is an Iceberg Order? Why Can an Iceberg Create a Retail Trap Without Manipulating Anything? What Is the Difference Between an Iceberg and Spoofing? What Is Absorption? What Parts of the Market Can a Retail Screen Not See? How Are Stocks and Futures Different? How Does Spoofing Work? How Does Layering Work? What Is Momentum Ignition? How Do Wash Trades and Matched Trades Distort the Tape? How Can the Open, Close and Settlement Be Manipulated? How Does Cross-Market Manipulation Work? What Other Manipulation Methods Do Retail Traders Commonly Miss? How Do Pump-and-Dump and Ramp-and-Dump Schemes Weaponize Retail Buying? What About Odd Lots, Small Lots and Quote Stuffing? Is “Stop Hunting” Real? What Looks Manipulative but Often Is Not? How Can Retail Traders Evaluate Suspected Manipulation? How Should You Read a Huge Volume Bar? What Do Common Green-Volume Traps Look Like in Practice? What Can Regulators See That Retail Traders Cannot? What Should a Trader Change After Learning This? What Are the Limits of This Framework? Conclusion: Stop Trading the Color
Why Does Green Volume Mislead Retail Traders?
Green volume misleads because the color invites the brain to convert activity into a story: green means buying, buying means demand, demand means smart money, smart money means price should rise. Each step adds an assumption the underlying volume count did not supply.
The first error is mechanical. In futures, CME explains that a traded contract increments volume whether the transaction is interpreted by one participant as buying or another as selling. Its educational material warns that a volume spike does not necessarily mean buyers are entering and that the same activity could reflect liquidation of long positions or initiation of short positions.[^cme-volume]
The second error comes from chart rendering. TradingView’s Volume Profile documentation says it uses up/down volume rather than buy/sell volume and, for that calculation, classifies volume from the price direction inside the bar.[^tradingview-volume] Other platforms may use different rules, which is precisely the point: the trader must know the formula behind the color.
The third error is causal. Even when a data feed identifies whether executions occurred at the bid or ask, aggressive-side classification still does not reveal the full intent, inventory or position of the participants. A market buy can be a new long, a short covering, a hedge adjustment, a stop order turned marketable, an arbitrage leg, a forced liquidation response or one leg of a larger strategy. The print records an execution. It does not print the trader’s mind next to it.
A green bar can therefore be bullish, bearish, neutral or simply inconclusive depending on what price did with the activity and what happened next.
The clue is not volume alone. It is volume relative to result.
Imagine two one-minute bars in the same futures contract.
Bar A trades 8,000 contracts and advances 18 ticks. Bar B trades 26,000 contracts, closes green, and advances only 2 ticks before reversing.
Bar B has more activity, but much less price progress per unit of activity. That does not prove distribution or an iceberg. It does tell the trader that the simplistic sentence “huge green volume means buyers are powerful” is not explaining the evidence very well.
For analytical purposes, Driftless News calls this impact efficiency:
\[ \text{Impact Efficiency} = \frac{ \text{Price Change} }{\text{Relative Executed Volume}} \]
This is an analytical heuristic, not an exchange statistic or standardized trading signal. The useful idea is qualitative: when activity explodes while price progress collapses, a large amount of opposing liquidity is being found somewhere. That opposing liquidity may be displayed, hidden, fragmented across venues or supplied dynamically. A trader who sees the mismatch should become more curious, not more certain.
What Does Volume Actually Measure?
Volume measures transactions completed during a defined period. It does not directly measure bullishness, bearishness, informed conviction, manipulation or future price direction.
For CME futures, the exchange says volume is calculated by counting contracts traded and explicitly notes that volume alone cannot reveal whether traders are buying or selling or opening or closing positions.[^cme-volume] Open interest is a separate measure of outstanding contracts, and even open interest does not identify the motives behind each position.[^cme-open-interest]
Stocks use shares rather than futures contracts, but the same conceptual discipline applies. A transaction requires a buyer and a seller. “More buyers than sellers” is usually sloppy language. What changes price is not a numerical imbalance in the existence of counterparties. It is the prices at which participants are willing or forced to transact and the amount of available liquidity at those prices.
A more accurate vocabulary is:
Retail shorthand Better language “There were more buyers.” “Buyers were more aggressive at the available prices,” if the execution data supports that conclusion. “Green volume means accumulation.” “High volume occurred during an up-classified bar; accumulation is a hypothesis requiring more evidence.” “Sellers disappeared.” “Price advanced through available liquidity; the amount and location of undisplayed liquidity remain unknown.” “Institutions bought.” “Large volume traded.” Participant identity is not established by volume alone. “That wick was stop hunting.” “Price traded through a level where stops may have been concentrated.” Intent remains unproven. “The iceberg manipulated price.” “Repeated liquidity may have been present.” Whether it was an iceberg, whether it was bona fide, and whether conduct was manipulative are separate questions.
This vocabulary sounds less exciting. It is also harder to bankrupt.
What Is an Iceberg Order?
An iceberg order is a genuine order in which only part of the total quantity is displayed to the market at one time. As the displayed portion executes, additional hidden quantity can be replenished according to the exchange or venue’s order mechanics.
CME’s own terminology is revealing. Its technical documentation has referred to Displayed Quantity orders as “Iceberg” orders and defines MaxShow as the maximum quantity shown in the order book at any given time.[^cme-displayed] Nasdaq’s reserve-order documentation likewise distinguishes executions involving the non-displayed portion of Reserve orders.[^nasdaq-reserve]
The central purpose is usually execution quality. A participant who wants to buy or sell a large position may not want the full quantity exposed because visible size can change other traders’ behavior, invite front-running or undercutting, or move the market before the parent order is complete.
Academic evidence does not support treating icebergs as synonymous with abuse. A 2021 study of U.S. agricultural futures found hidden-limit-order activity was economically significant in corn and live-cattle futures and reported evidence consistent with improved liquidity and market quality in the markets studied.[^shang-iceberg-2021] A later study of Australian equities found iceberg orders were used by both informed and liquidity traders and concluded that non-aggressive iceberg orders could support liquidity provision, especially in smaller illiquid stocks.[^lajbcygier-iceberg-2025]
An iceberg can hurt the trader who does not realize it is there. That does not make the iceberg illegal.
A sell iceberg can absorb aggressive buyers
Suppose a futures contract is trading at 5000.00. The visible offer at 5000.25 shows only 40 contracts. Buyers hit the offer. Forty trade. Another 40 appear. Then another 40. Hundreds or thousands of contracts can execute at or near that price while the visible quantity never looked particularly large.
To the retail trader watching candles, the event may look like powerful green volume. To the trader watching the DOM, the repeated refill may suggest hidden liquidity. To the participant who entered the order, it may simply be a large bona fide sell order being worked without broadcasting its full size.
If buyers eventually exhaust the hidden seller, price may break higher. If buyers exhaust themselves first, price may reverse sharply. The iceberg itself does not tell you which side will win.
Why Can an Iceberg Create a Retail Trap Without Manipulating Anything?
An iceberg can create a trap because retail traders often interpret effort as control. Aggressive buying produces visible activity, but a patient hidden seller may be willing to fill that buying without allowing price to advance very far.
The late buyer sees a green candle and record volume. The hidden seller sees incoming liquidity. That is the entire trap.
The term “trap” here describes a bad inference, not necessarily unlawful conduct. A bona fide participant is allowed to seek efficient execution. Hidden liquidity exists because revealing a very large order can itself create market impact. The 2025 iceberg research describes the mechanism directly: only part of an iceberg is disclosed, and the displayed quantity can replenish as it is executed.[^lajbcygier-iceberg-2025]
This creates one of the most useful distinctions in order-flow reading:
High volume + strong price progress suggests the aggressive side is finding and consuming liquidity efficiently. High volume + poor price progress suggests strong opposing liquidity or two-sided disagreement. High volume + failed breakout + reversal is evidence that the original aggressive move did not sustain. It is not, by itself, evidence of manipulation.
Retail gets into trouble when the third pattern is retroactively narrated as “the institutions trapped everyone with an iceberg.” Sometimes a large hidden participant was there. Sometimes several participants independently supplied liquidity. Sometimes a rebalance, hedge or arbitrage relationship mattered. Sometimes a manipulative scheme did exist. The chart alone cannot decide among those explanations.
What Is the Difference Between an Iceberg and Spoofing?
An iceberg conceals part of a real order that seeks execution. Spoofing uses an order entered with the intent to cancel before execution or otherwise create deceptive market information. Those are not the same behavior.
The CFTC’s statutory guidance describes spoofing as bidding or offering with intent to cancel before execution and says legitimate, good-faith cancellation or modification is not automatically spoofing.[^cftc-spoofing-guidance] CME Rule 575 similarly focuses on disruptive practices, misleading market depth, artificial price movement and intent.[^cme-rule-575]
Feature Iceberg / reserve order Spoofing Layering Core purpose Execute genuine size while limiting displayed exposure Create a deceptive appearance of pressure, depth or price interest Create deceptive pressure using multiple baiting orders at different price levels Does the participant generally want the parent order executed? Yes The spoof order is entered with intent inconsistent with bona fide execution The layered bait orders are non-bona fide; a beneficial order typically exists on the opposite side Is some size intentionally hidden? Yes, by design Not required Not required Is large displayed size required? No No; pattern and intent matter Multiple orders at levels are characteristic Can the displayed order cancel legitimately? Yes Cancellation is part of the deceptive pattern Bait orders are commonly cancelled after the beneficial execution Legal status Permitted order functionality when used lawfully Prohibited manipulative/disruptive conduct Prohibited manipulative conduct What can retail prove from one snapshot? Very little Very little Very little
One more point matters: a spoof order that never executes does not itself add trade volume. Volume records executions. Spoofing can change the behavior of other participants, causing them to execute trades that do add volume, but the cancelled bait order is an order-book event, not a completed trade.
That fact alone should make traders suspicious of the phrase “the giant green volume bar is an iceberg spoof.” It can combine three different data types—executed volume, hidden quantity and non-bona fide displayed orders—into a single story that the evidence never established.
What Is Absorption?
Absorption is a market-microstructure description for a situation in which aggressive orders repeatedly execute against opposing resting liquidity without producing proportionate price progress. It is a behavior in the auction, not a legal conclusion.
If market buyers repeatedly lift the offer and price barely advances, sellers are supplying enough liquidity to absorb that buying. If market sellers repeatedly hit the bid and price barely declines, buyers are absorbing the selling. The resting liquidity may come from one participant or many. It may be displayed or partially hidden. It may be static or replenished dynamically.
A genuine iceberg is one mechanism that can produce the visual signature of absorption because hidden quantity can replenish after executions.[^lajbcygier-iceberg-2025] It is not the only mechanism.
Why absorption matters more than the color of volume
Consider the sentence: “26,000 contracts traded on a green bar.” That describes activity and bar direction. Now add: “Price advanced two ticks, failed to hold the high, and traded below the bar’s low within three minutes.”
The second sentence changes the interpretation because it tells us what the market accomplished with the activity. Buyers may have been aggressive, but the market failed to sustain the auction higher.
That is more useful than saying “green volume is bullish.” The useful retail question is not “Was the bar green?” It is “What did all that volume buy in terms of price progress, and did the market accept the new price?”
What Parts of the Market Can a Retail Screen Not See?
A retail screen can show a great deal. It cannot show everything that matters.
That limitation is not a conspiracy. It is an architectural fact.
Driftless News calls the missing context the Six-Layer Market Reality Stack. The framework is original analysis designed to separate what traders can observe from what they often imagine they can observe.
Layer What exists What retail commonly sees What is often missing Chart layer Candles, bars, indicators derived from trade and quote data Nearly all of it, depending on feed The assumptions inside the indicator and the micro-events compressed into each bar Execution layer Actual completed trades Time-and-sales, aggregate volume, sometimes bid/ask classification Participant identity, full strategy, related executions elsewhere Displayed-liquidity layer Visible bids and offers Level II or DOM, depending on product and subscription Non-displayed quantity and liquidity outside the displayed view Hidden/venue layer Reserve orders, hidden orders, off-exchange venues, wholesalers, ATSs Partial or delayed evidence Resting interest that was never displayed to the trader Position/incentive layer Inventory, hedges, options exposure, cross-product positions, funding and risk limits Usually not observable in real time Why the participant needs to trade Intent/evidence layer Purpose of order entry, communications, algorithms, account relationships, repeated conduct Usually unavailable The evidence needed to distinguish lawful execution from manipulation
Most retail arguments about manipulation jump directly from Layer 1 to Layer 6. A trader sees a wick and infers intent. A trader sees a wall disappear and infers spoofing. A trader sees a green volume spike and infers institutional accumulation. A trader sees repeated size reload and infers an illegal iceberg. The missing layers are silently filled with a story.
That story may occasionally be right. The process is still weak.
U.S. equities are more fragmented than most charts make obvious
The SEC’s June 2026 Regulation NMS proposal describes a stock market operating across 17 active national securities exchanges, plus off-exchange ATSs, single-dealer platforms, wholesalers and other broker-dealer systems.[^sec-reg-nms-2026] The Commission’s economic discussion states that, since the end of 2024, off-exchange trading has regularly exceeded 50 percent of overall U.S. equity volume. It also reports that execution against hidden liquidity on exchanges has increased over time.[^sec-reg-nms-2026]
FINRA’s Trade Reporting Facilities exist specifically for transactions in exchange-listed securities that are effected otherwise than on an exchange.[^finra-trf] This does not mean price is fake. It means the visible exchange book is not a census of every trading interest in the stock.
A futures DOM is centralized, but hidden size still exists
For CME futures, electronic orders route through CME Globex for the contract being traded.[^cme-submitting-order] That centralization gives the futures trader a cleaner view of the exchange book than an equity trader looking across a fragmented U.S. stock market.
CME’s own Displayed Quantity functionality prevents the DOM from being a complete map of available size. A trader can therefore watch a level print far more volume than the quantity that ever appeared at that level at one time.[^cme-displayed]
This is not a failure of the DOM. It is the intended function of the order type.
How Are Stocks and Futures Different?
Stocks and futures can produce similar-looking candles while the market underneath those candles is materially different. For a retail trader, the distinction changes what can reasonably be inferred from visible liquidity.
Question U.S. exchange-listed stocks CME futures Where can trading occur? Many exchanges plus off-exchange venues and broker-dealer systems The CME contract’s electronic matching occurs on CME Globex, with other reportable execution mechanisms depending on product/rules Can liquidity be non-displayed? Yes, both on and off exchange Yes, including Displayed Quantity/iceberg mechanics Does a single visible order book show all market interest? No No Is the market structurally fragmented? Yes, substantially Less fragmented at the matching-engine level for a given CME contract Can related products influence behavior? Yes: stock, ETF, options, futures, baskets and correlated instruments Yes: outrights, spreads, options, cash markets and correlated futures Is spoofing prohibited? Yes, under securities laws/rules and exchange/FINRA enforcement frameworks Yes, under the Commodity Exchange Act and exchange rules Does high volume prove directional intent? No No
There is another distinction. Futures can involve leverage and rapid forced liquidation. A trader who is under-margined can become a price-insensitive seller or buyer because risk has to be reduced. That can create violent volume without any manipulator directing the move. The same principle applies in securities through margin calls and risk controls, but leverage is built deeply into the futures product design.
The practical rule is simple: do not copy an interpretation from one market to another without checking the market structure underneath it.
How Does Spoofing Work?
Spoofing uses orders to create a false impression of market interest while the trader seeks a beneficial execution elsewhere. The deceptive order is not meant to function as ordinary bona fide trading interest.
The Commodity Exchange Act’s spoofing provision, as interpreted by the CFTC, centers on bidding or offering with intent to cancel before execution.[^cftc-spoofing-guidance] The CFTC also says the analysis depends on context, trading patterns, fill characteristics and other facts. Legitimate order cancellation is common. Intent separates ordinary order management from prohibited spoofing.
A simplified spoofing sequence can look like this:
A trader wants to buy at a favorable price. The trader enters large sell orders above the market to create apparent selling pressure. Other participants respond to the apparent supply by lowering prices, changing quotes or selling. The trader executes genuine buy orders at improved prices. The large sell orders are cancelled.
The directions can be reversed. The manipulator may display fake buying pressure to obtain a better sale. FINRA describes quote spoofing as creating fabricated buying or selling pressure that entices other participants to adjust legitimate orders; after the fabricated interest is cancelled, the manipulator can transact on the opposite side.[^finra-potential-manipulation]
Spoofing is not a theory invented by retail traders
Regulators have brought major cases across futures, Treasuries and equities. In September 2020, the CFTC ordered JPMorgan entities to pay $920.2 million in a settlement involving manipulative and deceptive conduct and hundreds of thousands of spoof orders in precious-metals and U.S. Treasury futures over at least eight years.[^cftc-jpmorgan]
In August 2026, the SEC filed a settled action against Frank Cerisano Jr. alleging a four-year stock-spoofing scheme that generated about $1.116 million in ill-gotten gains. According to the SEC, Cerisano allegedly placed rapid non-bona fide orders on one side of a stock in one brokerage account, executed on the opposite side through another account, then cancelled the spoof orders.[^sec-cerisano]
The point is not that every disappearing wall is JPMorgan or Cerisano. The point is that real spoofing produces an evidentiary pattern much richer than “I saw size vanish.”
Why a disappearing order does not prove spoofing
Every active market has cancellations. Traders cancel because price changes, risk changes, another leg fills, a model changes its fair value, a quote loses priority, an order partially fills, exposure limits change, news arrives or the trader simply no longer wants the execution.
The CFTC says a legitimate, good-faith cancellation or modification does not become spoofing merely because an order was cancelled before it was completely executed.[^cftc-spoofing-guidance] The retail observer therefore needs two simultaneous beliefs:
Spoofing is real. Cancellation is not proof of spoofing.
Those statements do not conflict.
How Does Layering Work?
Layering is a manipulative strategy that uses multiple baiting orders at different price levels to create an artificial appearance of supply or demand while the trader seeks an execution on the opposite side. FINRA’s current manipulation-report documentation defines layering around multiple baiting limit orders entered at various price levels, an opposite-side execution, and cancellation of the baiting orders.[^finra-potential-manipulation] The sequence can vary, and surveillance does not require every event to occur in one rigid order.
A simplified example:
The trader wants to sell 10,000 shares at a favorable price. Multiple large buy orders are layered below the market at several levels. The book appears unusually bid-heavy. Other traders may interpret the apparent demand as support and raise their bids or buy the offer. The manipulator sells the genuine 10,000-share position. The layered buy orders are cancelled.
Layering weaponizes the visual order book because traders and algorithms respond to displayed depth. This is why the order book must be treated as conditional information, not a promise. A resting limit order is executable interest at the instant it exists, but it is also cancellable under ordinary market rules. The fact that orders can be cancelled makes markets responsive. The same capability can be abused when orders are entered to deceive.
Iceberg and layering can look almost opposite
The retail brain often labels any unusual size behavior “iceberg manipulation,” but the mechanics can point in opposite directions. An iceberg understates the full size of genuine interest by hiding quantity. Layering often overstates market interest by displaying multiple non-bona fide orders. Both can make the visible book an incomplete representation of economic reality. Only one is inherently deceptive in the manipulative sense described by FINRA.
That distinction is worth protecting because bad terminology leads to bad trading decisions. If the trader assumes a genuine hidden seller is a spoof who will disappear, the trader may keep buying directly into real supply. If the trader assumes a displayed wall is permanent, the wall may cancel and leave the trader positioned against a market that never had the advertised depth.
What Is Momentum Ignition?
Momentum ignition is an attempt to induce other participants to trade at artificially high or low prices by creating movement or signals that attract follow-on trading. FINRA has used the term for years in its surveillance guidance. Its 2023 and 2024 reports described potential momentum-ignition activity that can include spoofing or layering designed to bait participants, as well as cross-product transactions intended to manipulate an underlying security and affect related options.[^finra-momentum]
The mechanism matters because modern markets contain strategies that react to price, volume, volatility, book imbalance, breakouts and correlated instruments. A manipulator does not necessarily need to hold the market at an artificial level for hours. A short burst can be enough if it causes other systems and traders to provide the next wave of orders.
That creates a dangerous feedback loop:
\[ \text{Artificial Signal} \rightarrow \text{Follower Response} \rightarrow \text{Real Volume} \rightarrow \text{Stronger Signal} \rightarrow \text{More Followers} \]
The middle of that chain is important. Manipulation can recruit legitimate traders to produce genuine volume. By the time the retail trader sees a giant green bar, much of the bar may consist of real executions from people and algorithms reacting to the earlier signal.
The volume is real. The catalyst may not have been.
Why breakout traders are vulnerable
A breakout strategy often relies on a cluster of observations: price breaches resistance, volume expands, spreads remain acceptable, momentum increases and the move begins to attract attention. Those are rational ingredients. They also create a map of what can be imitated.
The answer is not to stop trading breakouts. The answer is to require evidence of acceptance rather than treating the first burst as proof. Does price hold above the breakout? Does liquidity continue to transact there? Does the move survive after the initial surge? Does the market immediately reject the new level?
Manipulation often exploits urgency. Patience is not a magic shield, but it changes the evidence set.
How Do Wash Trades and Matched Trades Distort the Tape?
Wash trading and matched or prearranged trading can create a false appearance of activity because transactions are coordinated so that the reported trading does not represent ordinary independent risk transfer and price competition.
Section 9(a)(1) of the Securities Exchange Act prohibits specified transactions and matched-order conduct carried out for the purpose of creating a false or misleading appearance of active trading or market conditions.[^uscode-78i] FINRA’s 2026 oversight report lists wash and prearranged trades among manipulation patterns firms should surveil and specifically notes the risk of activity designed to create the appearance of active trading.[^finra-2026] CME Rule 534 likewise requires orders to be entered in good faith for bona fide transactions and prohibits arrangements intended to negate market risk or price competition where the rule applies.[^cme-wash]
Why wash activity is dangerous to a volume reader
A volume indicator assumes an execution is economically informative. That assumption is weaker when participants are coordinating trades to manufacture activity.
A thin stock can appear to come alive:
volume rises from almost nothing; prints begin occurring rapidly; the chart becomes visually active; scanners detect unusual relative volume; social-media accounts notice the ticker; real outside traders enter because the market now appears liquid and interesting.
If the original activity was manipulative, later volume can still be genuine. The trap is recursive: artificial activity attracts authentic activity, and authentic activity makes the artificial origin harder for outsiders to see.
This is one reason regulators analyze account relationships and beneficial ownership. The tape alone shows a trade. It does not show whether the buyer and seller were economically independent.
How Can the Open, Close and Settlement Be Manipulated?
The open, close and settlement matter because they can determine benchmark values, portfolio marks, derivative payoffs, index calculations, margin outcomes and the prices displayed to the rest of the world. Manipulative activity concentrated near those windows can therefore have an economic payoff larger than the trading used to create the move.
FINRA’s 2026 surveillance guidance lists marking the close among the patterns firms are expected to detect.[^finra-2026] CME Rule 575 applies through pre-opening, closing and regular trading sessions and prohibits specified disruptive practices across those states.[^cme-rule-575] A crude version of marking the close is easy to understand: a participant executes trades near the end of the relevant pricing window with the purpose of moving the closing or settlement-related price rather than merely obtaining an ordinary execution.
The difficult part is not recognizing that prices move near the close. They are supposed to. The close is often one of the most active periods of the day. Index funds rebalance. Institutions execute benchmark orders. Options hedges change. Market-on-close orders interact. Traders reduce overnight risk. High volume and sharp movement near the bell can be completely legitimate. The distinction returns to purpose, pattern and economic context.
A closing-volume spike is not evidence of manipulation
Retail traders often see a final-minute volume bar dwarf the rest of the session and conclude that somebody “painted” the market. That conclusion skips the auction mechanics.
The correct sequence is:
Identify whether the instrument has an opening or closing auction and how the benchmark is formed. Check whether the day involved index rebalancing, expiration, major news or another known flow event. Compare the volume with normal closing behavior for that instrument. Separate legitimate benchmark execution from activity that appears designed to create an artificial price. Do not infer illegal intent from a large close alone.
A market can be mechanically strange and legally clean at the same time.
How Does Cross-Market Manipulation Work?
Cross-market manipulation uses trading in one instrument or venue to influence the price or perceived value of another instrument where the manipulator has an economic interest. A stock and its options are the easiest retail example. If a trader can move the underlying stock price, even briefly, the move can affect option values. The same logic can involve ETFs, components, futures, cash instruments and other correlated products.
FINRA’s manipulation guidance tells firms to monitor across multiple platforms and related financial instruments and specifically discusses strategies that manipulate an underlying security to affect an overlying options position.[^finra-2026][^finra-momentum] The SEC’s litigation against Lek Securities and others provides a concrete historical example. A jury found defendants liable for market manipulation, and the Second Circuit later affirmed the judgment. The SEC case included layering and cross-market conduct involving stocks and options.[^sec-lek]
Why single-chart analysis fails here
Suppose a stock moves abruptly during the final minutes of trading. The stock chart shows the move. It does not show:
an options position that benefits from a strike finishing in or out of the money; an ETF or basket position linked to the stock; futures exposure that changes the economic payoff; related trading on another venue; whether the stock trade itself was profitable or intentionally loss-making because the gain was elsewhere.
A retail trader can stare at the stock chart for hours and never see the actual incentive. Cross-market manipulation is a reminder that the instrument being moved does not have to be the instrument where the money is made.
What Other Manipulation Methods Do Retail Traders Commonly Miss?
Market manipulation is broader than spoofing. The CFTC’s current glossary describes manipulation as planned conduct that causes or maintains an artificial price and specifically names corners, squeezes, unusually large purchases or sales used to distort prices, and false information used to distort prices.[^cftc-glossary-manipulation] Investor.gov gives the securities-market version in similarly broad terms: artificial changes to supply or demand can involve false information, transactions that create the appearance of activity, or rigged quotes, prices or trades.[^investorgov-manipulation]
That broader definition matters because a retail trader who learns only “fake wall equals spoofing” can miss manipulation that uses real executions, real positions or real human attention as the mechanism. Some of the most consequential schemes do not look fake on the tape at all.
Corners and squeezes can weaponize control of deliverable supply
A corner or manipulative squeeze is a market-power problem rather than an order-book illusion. The CFTC defines a corner around control of a commodity or deliverable supply sufficient to manipulate price; its definition of a squeeze describes a condition in which scarce supply can force shorts to cover at higher prices.[^cftc-glossary-manipulation] The Commission’s market-surveillance program monitors positions, deliverable supply, cash-market relationships and price aberrations because futures contracts tied to finite deliverable supply can become vulnerable to this kind of pressure.[^cftc-market-surveillance]
A genuine shortage can also produce a squeeze without proving unlawful manipulation. Deliverable supply can become scarce because of weather, logistics, inventory conditions, financing constraints or ordinary positioning. The evidentiary question is whether a participant obtained or used market power in a way that produced an artificial price, not merely whether shorts suffered or the front month became expensive.
For retail futures traders, potential warning signs include extreme front-month spreads, unusual divergence between deliverable cash values and futures, concentrated positions, rapidly changing delivery economics and price behavior that becomes difficult to explain with ordinary supply and demand. Those signs justify investigation. They do not identify the responsible participant or establish intent.
Real trades can be manipulative even when every order executes
Spoofing can teach the wrong meta-lesson if traders conclude that manipulation always requires orders that were never intended to trade. Section 9 of the Exchange Act prohibits, among other conduct, a series of transactions undertaken for the purpose of creating actual or apparent active trading or raising or depressing a security’s price to induce others to trade.[^uscode-78i] The CFTC glossary likewise includes unusually large purchases or sales made over a short period to distort prices.[^cftc-glossary-manipulation]
That means execution is not a safe-harbor test for intent. A manipulator can use genuine completed trades to move a reference price, trigger algorithms, create momentum, affect a derivative payoff or induce other participants to enter. The trades can be real while the price signal they were designed to create is artificial.
This distinction closes another retail loophole in reasoning. “The volume was real” does not prove the market move was organic. It proves that executions occurred. Whether those executions reflected ordinary price discovery or a manipulative purpose requires more evidence.
False information can manipulate price before the tape shows anything unusual
Manipulation can begin in language rather than orders. Investor.gov warns that false or misleading information can be used to affect a security’s supply, demand or price, and its social-media fraud guidance notes that false rumors can be positive or negative.[^investorgov-manipulation][^investorgov-rumors]
A positive rumor can create a buying frenzy. A negative rumor can induce selling and allow a wrongdoer to benefit from lower prices or a related position. The market data that follows may be perfectly authentic because real investors are responding to false information. Once again, the tape can record genuine transactions generated by a deceptive cause.
This is why source verification belongs inside trading risk management. A trader who buys because “volume confirms the news” can become trapped if the news itself was fabricated. Price action cannot independently authenticate the claim that caused the price action when the audience responding to that claim is part of the mechanism.
Promotion can hide an economic conflict
Investor.gov also warns about a social-media scheme it calls scalping in the fraud context: a person recommends a stock, helps drive interest or price, then sells into the resulting demand.[^investorgov-social-fraud] The word has other meanings in ordinary trading, so the context matters. Here it describes a hidden conflict between the public recommendation and the promoter’s private economic behavior.
The lesson is broader than any label. When a person urging the public to buy has an undisclosed position, compensation arrangement or plan to sell into the audience’s demand, the retail trader should evaluate the promoter’s incentive separately from the chart. A persuasive call followed by a rising price is not self-validating evidence when the caller may benefit from creating the rise.
The common thread across corners, transaction-based manipulation, false-rumor campaigns and conflicted promotion is that the visible market event can be real while the causal story is deceptive. Retail protection therefore requires more than recognizing fake orders. It requires asking who benefits, what mechanism creates the price signal, what evidence is missing and whether the observed activity can be explained by legitimate market structure.
How Do Pump-and-Dump and Ramp-and-Dump Schemes Weaponize Retail Buying?
Pump-and-dump and ramp-and-dump schemes manipulate attention and demand so that outside investors become the liquidity that allows earlier holders to exit at inflated prices. This is the manipulation category most likely to reach retail through a phone rather than a matching engine.
FINRA’s April 2025 investor guidance describes the classic sequence: fraudsters accumulate a position, promote the stock, attract buying, then dump shares into the demand they helped create.[^finra-pump-dump] The modern version is more targeted. FINRA’s December 2025 alert says fraudulent investment groups often begin with familiar stocks, move victims into low-priced and low-volume exchange-listed names, then tell members which stocks to buy, how much, and at what times and prices. FINRA says this can lead victims to unwittingly push the stock price upward before the market crashes.[^finra-investment-groups]
FINRA’s 2026 oversight report adds a chilling market-structure detail. In the schemes it observed, victim purchases using coordinated limit orders could coincide with share liquidations by accounts presumed controlled by bad actors.[^finra-2026] The victims are not merely buying the pump. They can become the pump.
Why the chart looks convincing during a real scam
A successful ramp-and-dump can produce exactly the technical evidence a momentum trader has been trained to respect:
a clean breakout; accelerating price; unusual relative volume; expanding social attention; repeated “confirmation” from people in a group chat; apparent proof that previous calls from the promoter worked; a low float that allows price to move quickly.
The chart is not necessarily fabricated. The demand is real because victims are actually entering orders. What is deceptive is the coordination, promotion, ownership structure, undisclosed incentive or plan to dump into that demand. This is why “the chart is going up” cannot validate the story that caused the chart to go up.
The low-float problem
Low-float and low-volume stocks require less capital to move than highly liquid large-cap stocks. FINRA warns that low-priced stocks with limited public information can be targets for manipulation and that control of the public float can give bad actors greater control over the market.[^finra-pump-dump]
That does not make every low-float trade fraudulent. It changes the amount of force required to create price movement and the difficulty of exiting when everybody discovers the same door at once.
Retail traders should treat three conditions as a dangerous combination:
low liquidity + coordinated promotion + urgency. The fact that the security trades on an exchange does not neutralize that combination.
What About Odd Lots, Small Lots and Quote Stuffing?
Manipulation does not always require a huge visible order. Small transactions and message traffic can matter when they are used strategically to move price, alter signals or burden market systems.
FINRA’s 2026 report includes odd-lot manipulation among the patterns firms should surveil.[^finra-2026] In April 2026, the SEC charged day trader Harsh Patel in an alleged scheme that, according to the complaint, used numerous small-lot market orders to raise stock prices, followed by non-bona fide buy limit orders that allegedly created false additional buying interest before larger sales occurred.[^sec-patel]
The alleged sequence is valuable educationally because it breaks a common assumption: manipulation does not need one cinematic “whale” order. Repetition can matter more than the size of any single message.
Quote stuffing is a different type of problem
CME Rule 575 prohibits, among other conduct, entering or modifying messages with intent to overload, delay or disrupt exchange systems, as well as entering messages with intent to create a misleading appearance of market depth.[^cme-rule-575] In plain English, order traffic itself can become part of the abusive behavior. Retail traders should avoid collapsing all rapid order changes into “quote stuffing.” Modern electronic markets update constantly. Algorithms cancel and replace orders for legitimate reasons at speeds humans cannot follow. A high cancellation rate may be suspicious in context, but speed and cancellation are not standalone proof of abuse.
This is another place where retail video clips can overstate what they show. A recording of a flickering DOM may document that the book changed rapidly. It does not establish why.
Is “Stop Hunting” Real?
The phrase “stop hunting” is too broad to be reliable. Stop-triggered moves are real. Deliberate manipulation intended to create artificial price movement can be real. The claim that every sweep of an obvious high or low proves somebody targeted retail stops is not supported by the chart alone.
Stops cluster for ordinary reasons. Traders learn the same technical levels. Risk models react near the same volatility points. Breakout orders sit beyond prior highs. Protective sell stops accumulate below visible support. Once price reaches one cluster, triggered orders can become marketable and consume the next layer of liquidity. That can accelerate movement without any trader personally “hunting” anyone. The CFTC’s spoofing guidance is useful here because it separates legitimate stop-loss behavior from spoofing and says properly placed stop-loss orders and good-faith order modifications are not automatically violations.[^cftc-spoofing-guidance] The more precise question is not “Did they hunt stops?” It is:
Was there evidence of intentional deceptive trading designed to create an artificial move, or did normal liquidity mechanics trigger a cascade around a widely watched level?
A chart can often show the cascade. It usually cannot answer the intent question.
Liquidity sweeps can be self-reinforcing
Suppose the prior day’s high sits at 100.00. Breakout buyers place stop entries above it. Short sellers place protective buy stops above it. Price reaches 100.02. Both groups begin buying. Market makers and other liquidity providers adjust. Momentum systems detect the break. More buying arrives.
The result can be a fast vertical move followed by a reversal once the forced buying is exhausted. A trader who bought at the top may feel targeted. The market did not need to know that trader existed. The market only needed to know, probabilistically, that many traders use similar levels.
The difference matters because a false model creates bad risk management. If every loss is blamed on a personal stop hunter, the trader never asks whether the entry was made where everybody else had the same idea.
What Looks Manipulative but Often Is Not?
Several ordinary market behaviors can produce ugly charts, disappearing liquidity, abrupt price movement or massive volume without manipulation. The distinction protects traders from two opposite errors: trusting everything and distrusting everything.
Behavior Why it can look suspicious Legitimate explanation that may fit Iceberg / reserve replenishment Size keeps reappearing after fills Genuine large parent order being executed while hiding total quantity Fast order cancellations Walls appear and disappear Market-making quotes adjusting to price, inventory, volatility or new information Huge close volume One bar dwarfs the session Closing auction, index rebalance, benchmark execution, portfolio flow Sudden stop cascade Price races through an obvious level Clustered stop orders and breakout orders becoming marketable Violent futures move Price accelerates with little pullback Leveraged liquidation, margin pressure, news repricing, thin liquidity Large volume with little movement “Somebody is holding it down” Genuine two-sided absorption or a large passive order Price move in a stock with options activity “They are manipulating the stock for options” Legitimate hedging, arbitrage or risk adjustment across related products Thin-stock vertical rally Looks manufactured Genuine news can move illiquid stocks violently; manipulation is one possible explanation, not the default conclusion
Legitimate high-frequency trading is not synonymous with manipulation
Regulators distinguish lawful automated trading from abusive conduct. The CFTC’s spoofing guidance explicitly rejects the idea that every cancelled order is illegal and evaluates facts, circumstances, patterns and fill characteristics.[^cftc-spoofing-guidance] FINRA’s long-running algorithmic-trading guidance likewise focuses on surveillance for manipulative strategies rather than treating automation itself as misconduct.[^finra-momentum]
The market needs orders to be cancellable. A liquidity provider forced to leave stale quotes in the book would either take enormous risk or quote much wider. The same flexibility that allows legitimate markets to function can be weaponized by a manipulator. Regulation has to distinguish the use from the abuse.
Hidden liquidity can improve market quality
This point deserves emphasis because it runs against the internet version of the iceberg story. The 2021 agricultural-futures study found that iceberg/hidden-limit-order activity represented a meaningful share of trading in the studied corn and live-cattle markets and reported results consistent with improved liquidity and reduced volatility.[^shang-iceberg-2021] The 2025 equity study found both informed and liquidity-driven use of icebergs, with non-aggressive iceberg activity supporting liquidity provision in small stocks.[^lajbcygier-iceberg-2025]
Hidden liquidity creates information asymmetry for the observer. It can also reduce the market impact faced by the participant trying to execute a large real order. Both can be true.
How Can Retail Traders Evaluate Suspected Manipulation?
Retail traders can evaluate suspected manipulation by climbing an evidence ladder instead of jumping from a visual anomaly to an accusation. The Retail Manipulation Evidence Ladder is an original Driftless News framework. It does not determine guilt. It ranks the quality of the evidence a trader has actually observed.
Level Evidence What the trader can responsibly say Feeling “That move looked wrong.” Nothing factual about manipulation yet. Price anomaly Unusual wick, reversal, gap, acceleration, failed breakout The price behavior was unusual relative to the trader’s baseline. Volume anomaly Abnormal executed volume or relative volume Trading activity was unusual. Intent remains unknown. Order-book anomaly Repeated walls, cancellations, replenishment, unusual depth changes Displayed liquidity behaved unusually. Legitimate explanations remain possible. Repeated pattern Similar behavior repeats with opposite-side executions or predictable cancellations There is a pattern worth documenting and investigating. Cross-market/account evidence Related positions, multiple accounts, correlated instruments, beneficial execution The economic incentive and mechanism become more coherent. Retail rarely has complete access to this level. Intent evidence Communications, code, instructions, admissions, account records, statistically compelling conduct Regulators or litigants may be able to establish deceptive intent or a legal violation. Adjudicated result Settlement, order, verdict or final judgment The matter has an official legal outcome, subject to the terms and posture of that outcome.
Most social-media “manipulation proof” never gets above Level 2 or Level 3. Regulators work higher. FINRA’s surveillance systems examine patterns across firms, accounts, customers, products and time. Its 2026 oversight report tells firms to monitor different alert types, related accounts, cross-platform activity and correlated products.[^finra-2026] The SEC’s 2026 Cerisano release describes alleged activity spread across different brokerage accounts on opposite sides of the same stock.[^sec-cerisano] The Patel complaint, as summarized by the SEC, describes a repeated sequence alleged to have occurred more than a thousand times across hundreds of stocks.[^sec-patel] That is what evidence depth looks like.
The trader’s job is risk control, not courtroom proof
A retail trader does not need to prove manipulation before deciding not to trade.
That distinction is liberating. The standard for accusing someone of wrongdoing should be high. The standard for protecting your own capital can be much lower. If a market behaves in a way you cannot model, spreads become unstable, displayed liquidity repeatedly disappears, a thin stock is being promoted by strangers, or a breakout is failing despite extreme volume, the trader can reduce size, wait, exit or refuse the setup without deciding who caused it. You are allowed to say, “I do not understand this auction well enough to risk money here.” That is a complete trading decision.
How Should You Read a Huge Volume Bar?
A huge volume bar should trigger a five-question protocol, not an automatic buy or sell signal. The Large Volume Bar Protocol is another original Driftless News decision framework.
What does the volume number actually count?
Identify the instrument and feed. Stocks count shares. Futures count contracts. Some instruments or platforms use tick volume. Some indicators classify up/down volume using price movement rather than aggressor identity.[^tradingview-volume] If you do not know how the platform calculated the bar, do not build a sophisticated story on top of its color.
How much price progress did the volume produce?
Compare the activity with the result.
Huge volume with large directional progress can indicate successful aggressive pressure. Huge volume with tiny progress can indicate absorption or intense two-sided trading. Huge volume with a breakout that immediately fails tells you the market rejected the attempted expansion.
The point is not to predict the next bar mechanically. It is to stop treating activity as accomplishment.
Where did the event occur?
Location changes meaning. A 5x relative-volume bar in the middle of nowhere is different from the same bar at:
a prior high or low; a major opening range boundary; a well-traded volume node; the cash-market open or close; an economic release; an expiration or roll window; a thin overnight session; a breakout from a multi-day range.
Context does not turn the bar into a guarantee. It tells you what auction problem the market was attempting to solve.
What happened immediately after the volume?
Follow-through is evidence. A move that holds above the high-volume area says something different from a move that instantly trades back through it. A seller absorbing buyers may eventually be exhausted. A buyer absorbing sellers may fail. A spoofing sequence can stop once the beneficial execution is complete. A news-driven repricing may never revisit the original level. The next evidence often matters more than the dramatic bar itself.
What can this screen not tell me?
Force yourself to name the unknowns. For stocks: off-exchange activity, hidden exchange orders, routing, wholesaler activity, related options and ETF positions, participant identity. For futures: hidden quantity, related spreads and options, cash-market hedges, participant identity, inventory and intent. The purpose of this question is not paralysis. It is to prevent certainty from outrunning evidence.
The compact decision table
Observation Better first interpretation What to watch next Giant green volume + strong close near high Aggressive demand achieved price progress during the interval Acceptance above the high-volume area; ability to hold new prices Giant green volume + narrow range Heavy two-sided trade / possible absorption Which boundary breaks after the high-volume balance Giant green volume + long upper wick Buyers traded aggressively but higher prices were rejected within the bar Whether price retests and accepts the upper area or loses the bar’s structure Breakout + volume surge + instant failure The breakout did not achieve acceptance Return into prior range; whether follow-on sellers gain control Repeated heavy prints at same offer Persistent selling liquidity may be present, possibly hidden Whether the level finally lifts or buyers exhaust Repeated heavy prints at same bid Persistent buying liquidity may be present, possibly hidden Whether the level finally breaks or sellers exhaust Huge visible wall that vanishes before contact Displayed interest was cancelled Repetition, opposite-side execution, and context; do not call spoofing from one event Thin stock + social promotion + rapid volume explosion Manipulation risk is elevated Float, disclosures, promoter identity, liquidity, ability to exit, regulatory warnings
What Do Common Green-Volume Traps Look Like in Practice?
The following examples are stylized. They are not allegations about any real security or participant. Their purpose is to show how identical-looking volume can arise from different mechanisms.
Case 1: The legal sell iceberg
A liquid futures contract approaches resistance. The visible offer looks modest. Aggressive buyers lift it repeatedly. The DOM keeps replenishing. Thirty thousand contracts trade over several minutes, much of the volume appearing during green bars. Price gains only a few ticks. A late trader buys because “institutions are clearly buying.”
The hidden seller is genuine. It continues to execute. Once the wave of aggressive buying weakens, price rotates lower. What was true: large buying aggression met large selling liquidity. What was not established: manipulation. What the late buyer got wrong: volume was interpreted as one-sided control rather than two-sided execution.
Case 2: The seller is finally exhausted
Use the same opening facts. This time the hidden seller has 8,000 contracts left. Aggressive buyers keep trading. The refill stops. The offer lifts. Price quickly auctions higher because the large source of supply is gone. The trader who automatically shorts every “iceberg” gets trapped instead. Lesson: detecting hidden liquidity is not the same as knowing its remaining quantity.
Case 3: The spoofed wall
A stock shows a large stack of sell orders above the market. The apparent supply pressures bids lower. A participant buys through a separate order sequence. The large sell interest repeatedly cancels as the market approaches it. If regulators can establish that the sell orders were non-bona fide and entered to deceive participants while the trader sought beneficial buys, the pattern can fit spoofing or layering concepts described by FINRA and the CFTC.[^finra-potential-manipulation][^cftc-spoofing-guidance] What retail sees: a wall appearing and disappearing. What retail does not automatically know: the trader’s intent, account relationships or opposite-side executions.
Case 4: The green bar created by short covering
A futures contract breaks above a widely watched high. Short sellers’ protective stops trigger. Breakout traders buy. Price rises quickly and volume surges.
The bar is green. The volume is real. Much of the buying can be existing shorts purchasing contracts to close risk rather than new bullish investors establishing long exposure. CME explicitly warns that volume cannot distinguish opening from closing activity.[^cme-volume] Lesson: buy executions do not tell you whether the buyer is entering a bullish position or exiting a bearish one.
Case 5: The social-media ramp
A low-float exchange-listed stock is promoted inside an encrypted investment group. Members are told exactly when and where to buy. The coordinated retail orders lift the stock. Public scanners detect the move. Unaffiliated momentum traders join. Volume explodes. The promoter’s earlier calls appear brilliant because price is rising in real time. Bad actors sell into the demand. FINRA has described this general pattern in 2025 and 2026 investor and regulatory guidance.[^finra-investment-groups][^finra-2026] Lesson: authentic retail buying can be the mechanism of a manipulation scheme.
Case 6: The closing auction that looks criminal on a one-minute chart
A large-cap stock trades ordinary volume all afternoon. The final minute prints a massive bar and the close jumps several basis points.
The day is an index-rebalance date. Institutions and index funds have benchmark orders concentrated in the closing auction. Lesson: abnormal relative volume is not abnormal once the correct market event is included in the comparison.
Case 7: The alleged small-lot scheme
The SEC’s April 2026 Patel case is useful because it shows an alleged manipulation pattern that does not begin with one giant order. The agency alleges Patel used many small-lot market buys to push stock prices higher, then placed non-bona fide buy limits that falsely indicated additional demand, sold in larger transactions, and cancelled the buy limits.[^sec-patel]
The case is an allegation unless and until resolved in accordance with its legal posture. Educationally, it demonstrates why sequence matters more than any isolated trade size.
What Can Regulators See That Retail Traders Cannot?
Regulators and exchanges can reconstruct market behavior across dimensions that are usually unavailable to a retail trader in real time. That is why official surveillance is built around patterns rather than screenshots. FINRA’s Potential Manipulation Report uses order-entry and trading data to generate layering and cross-market quote-spoofing exceptions.[^finra-potential-manipulation] Its 2026 regulatory report tells firms to monitor relationships among accounts, different alert types, multiple platforms, correlated instruments and patterns across time.[^finra-2026]
Depending on the investigation and authority, regulators may be able to examine:
exact order-entry, modification and cancellation timestamps; account ownership and control; beneficial ownership relationships; the sequence between bait orders and money orders; executions across broker-dealers and venues; positions in related securities, options, ETFs or futures; communications among participants; algorithmic code or trading logic; funding flows; repeated conduct over days, months or years; whether the trader profited from the opposite side of the apparent pressure.
The gap between that evidence and a five-second social-media video of a DOM is enormous.
Enforcement cases show what a complete narrative requires
The 2026 Cerisano release does not merely say the SEC saw cancelled orders. It alleges non-bona fide orders, artificial price movement, opposite-side executions in another brokerage account, cancellation of the spoof orders and approximately $1.116 million in ill-gotten gains.[^sec-cerisano]
The 2020 JPMorgan CFTC matter did not rest on one suspicious afternoon. The order covered conduct spanning at least eight years and hundreds of thousands of spoof orders in precious-metals and U.S. Treasury futures.[^cftc-jpmorgan]
The 2022 Lek litigation release refers to a jury verdict and an appellate affirmance in a layering and manipulative-trading case.[^sec-lek] The evidentiary scale is the lesson. Retail traders should be willing to notice anomalies. They should be reluctant to confuse anomaly detection with adjudication.
What Should a Trader Change After Learning This?
The most useful change is not a new indicator. It is a stricter burden of proof for your own interpretations.
A trader who once said, “Huge green volume means buyers are coming in,” should now ask, “How much price progress did that activity produce, where did it occur, what liquidity opposed it, and what happened after?” A trader who once said, “That wall disappeared, so it was spoofing,” should now ask, “Did the behavior repeat, was there a beneficial execution on the opposite side, and what legitimate reasons could explain the cancellation?” A trader who once said, “They stop-hunted me,” should now ask, “Was my stop sitting where a predictable concentration of orders was likely to exist?”
A trader who once said, “The iceberg is manipulating the market,” should now ask, “Is this genuine hidden liquidity seeking execution, or is there evidence of non-bona fide displayed interest designed to deceive?” Those substitutions are not semantic fussiness. They change risk decisions.
Build a pre-trade manipulation-risk checklist
Before entering a short-horizon trade where market microstructure matters, document:
Instrument: stock, ETF, futures contract, option or other product. Liquidity regime: normal, thin, news-driven, overnight, open, close, expiration, roll. Data limitations: what your feed does and does not show. Volume definition: shares, contracts, tick volume, bid/ask classification or up/down proxy. Price response: strong progress, weak progress, rejection or balance. Displayed-depth behavior: stable, replenishing, rapidly cancelling, unusually asymmetric. Hidden-liquidity hypothesis: possible, likely, or unsupported; never “proven” from a refill alone. Manipulation hypothesis: what specific conduct would have to be occurring? Alternative explanations: at least two lawful mechanisms that could produce the same visual evidence. Invalidation: what observation would prove your trade thesis wrong? Exit liquidity: especially for low-float or promoted securities, can you reasonably get out?
The checklist forces a trader to pay an assumption tax before risking capital. If the thesis requires five invisible things to be true, size should not be based on the confidence of one visible bar.
Do not trade allegations
A market can be manipulated and still be impossible for a retail trader to trade profitably. Knowing that something looks abusive does not tell you when it will stop, which side has more capital, whether a regulator will intervene, or whether price will move in the direction that seems morally appropriate. The market does not owe the victim of manipulation an immediate reversal. Risk management remains necessary even when the trader’s suspicion is correct.
Use regulatory reporting channels when the evidence is serious
FINRA provides mechanisms for regulatory tips and investor complaints. The CFTC and SEC also maintain channels for tips, complaints and referrals.[^finra-2026] If a trader possesses specific records, communications, repeated order patterns or evidence of coordinated fraud, preserving the evidence and reporting it is more useful than turning the allegation into engagement bait online.
What Are the Limits of This Framework?
This framework cannot turn retail market data into omniscience. It is designed to do the opposite: keep inference inside the boundary of available evidence. Several limitations matter.
Bid/ask classification is imperfect
Even sophisticated order-flow tools can make assumptions about aggressor side, sequencing and venue data. The exact method depends on the feed and platform. A trader should understand whether the tool uses exchange flags, quote tests, tick rules, bar direction or another heuristic.
Iceberg detection is often inferential
Some native exchange data or specialized datasets can identify hidden-order behavior more directly; ordinary retail observers often infer it from repeated executions and replenishment. Academic research has developed methods for identifying iceberg activity, but detection quality depends on market design and data access.[^shang-iceberg-2021][^lajbcygier-iceberg-2025]
Seeing 5,000 contracts trade against a level that displayed 100 at a time is strong evidence that more liquidity existed than was simultaneously displayed. It does not necessarily identify one participant, one parent order or one motive.
Manipulation law is conduct- and fact-specific
This article uses regulatory definitions and enforcement examples to teach concepts. It is not a substitute for legal analysis. Securities manipulation can implicate Section 9 of the Exchange Act, Section 10(b), Rule 10b-5, FINRA rules and other provisions. Futures manipulation and disruptive trading can implicate the Commodity Exchange Act, CFTC rules and exchange rules. The precise elements vary.[^uscode-78i][^cftc-spoofing-guidance]
Enforcement releases have different legal postures
A settled order, a complaint, a jury verdict and an appellate decision are not the same thing. The Cerisano matter discussed here was filed as a settled action in August 2026. The Patel matter was an SEC complaint filed in April 2026 and is described as alleged conduct. The Lek release reports an appellate affirmance following a jury verdict.[^sec-cerisano][^sec-patel][^sec-lek]
That distinction is not decorative. It is evidence discipline.
Market structure changes
The SEC was actively reconsidering major Regulation NMS provisions in 2026. Its June proposal would rescind the trade-through rule and locked/crossed-market restrictions if ultimately adopted as proposed.[^sec-reg-nms-2026] This article therefore treats the proposal as evidence about the SEC’s current market-structure analysis, not as a final rule already in force. Fresh market-structure education has to distinguish current rules from proposed rules.
Conclusion: Stop Trading the Color
The market does not become simple because the chart is colorful. A giant green volume bar can accompany genuine accumulation. It can also accompany distribution, absorption, short covering, forced flow, a closing auction, a low-float ramp, a failed breakout or a move influenced by manipulative conduct. The bar does not contain enough information to choose among those explanations by itself.
Iceberg orders expose the mistake perfectly. A hidden order can absorb an extraordinary amount of aggressive flow while displaying only a fraction of its size. That can trap the trader who equates green volume with bullish control. The order may still be completely legitimate. Academic research and exchange rules both make that clear.[^cme-displayed][^shang-iceberg-2021][^lajbcygier-iceberg-2025]
Spoofing and layering belong in a different bucket. Those practices involve deceptive order entry, false pressure or non-bona fide interest. Regulators have prosecuted them in stocks, futures, Treasuries and related markets, sometimes at enormous scale.[^cftc-jpmorgan][^sec-cerisano][^sec-lek]
The distinction gives retail traders a better mental model:
Displayed liquidity is not total liquidity. Executed volume is not directional intent. Price movement is not proof of manipulation. Suspicion is not evidence. And a legal hidden order can trap a bad reader of the market without cheating that reader at all.
The goal is not to believe the market is fair at every instant. The record shows that manipulation exists. The goal is to become harder to manipulate because you stopped mistaking the screen for the whole machine.
Source Notes: What the Sources Actually Say
CME Group — “What Is Volume?”
CME’s futures education material is unusually direct about the central misconception in this article. Its key sentence is: “What volume can’t show however, is whether traders are buying or selling, or opening or closing a position.” The page also gives an example where a volume spike could reflect new longs, long liquidation or new shorts. This source supports the Volume–Direction–Intent Separation Principle and the warning against reading a green futures volume bar as proof of bullish positioning.[^cme-volume]
TradingView — “Volume Profile Indicators: Basic Concepts”
TradingView documents that its Volume Profile calculation uses “up/down volume instead of buy/sell volume” and classifies it from price direction inside bars. This source does not establish how every broker or charting package colors every volume bar. It establishes why traders must inspect the calculation rather than infer participant identity from a color.[^tradingview-volume]
CME Group — Displayed Quantity technical documentation
CME documents Displayed Quantity functionality and defines MaxShow as “Maximum quantity of an order to be shown in the order book at any given time.” This is primary exchange evidence that iceberg-style partial display is an ordinary supported market mechanism rather than proof of manipulation.[^cme-displayed]
Nasdaq — Non-Displayed Reserve Orders
Nasdaq’s technical update states that exchange executions can involve the non-displayed portion of Reserve orders and assigns a liquidity flag to that activity. The source supports the claim that hidden/reserve liquidity exists inside U.S. equity exchange mechanics.[^nasdaq-reserve]
SEC — June 2026 Regulation NMS proposal
The SEC proposal describes a U.S. equity market with 17 operating NMS-stock exchanges and rising use of non-displayed liquidity. Its economic discussion says off-exchange market share had been “regularly exceeding 50% of overall volume” since late 2024. The article uses these figures as the Commission’s 2026 market-structure analysis. It does not present the proposal itself as a final rule.[^sec-reg-nms-2026]
CFTC — 2013 Antidisruptive Practices Authority guidance
The CFTC quotes the statutory spoofing concept as “bidding or offering with the intent to cancel the bid or offer before execution.” More important for retail interpretation, the Commission says legitimate, good-faith cancellations and modifications do not automatically violate the spoofing provision and that context, patterns and fill characteristics matter.[^cftc-spoofing-guidance]
FINRA — Potential Manipulation Report
FINRA provides operational definitions for layering and cross-market quote spoofing used in its surveillance reporting. The material describes baiting or fabricated interest, opposite-side executions and cancellation patterns. This source supports the article’s distinction between a lawful hidden order and deceptive displayed interest.[^finra-potential-manipulation]
FINRA — 2026 Annual Regulatory Oversight Report
FINRA’s 2026 report lists layering, spoofing, wash trades, prearranged trades, marking the close and odd-lot manipulation among patterns that surveillance systems should address. It also documents evolving small-cap manipulation schemes in which coordinated victim purchases can coincide with bad-actor liquidations.[^finra-2026]
CFTC — Futures Glossary and Market Surveillance Program
The CFTC glossary defines manipulation broadly enough to include corners, squeezes, short bursts of unusually large purchases or sales used to distort price, and false information used to distort price. The Commission’s market-surveillance material explains why deliverable supply, concentrated positions, cash-market relationships and price aberrations matter when evaluating squeeze or corner risk.[^cftc-glossary-manipulation][^cftc-market-surveillance]
Investor.gov — Market Manipulation and Social-Media Fraud
Investor.gov describes manipulation as artificially affecting supply or demand and identifies false information, transactions that manufacture apparent activity, and rigged quotes, prices or trades as examples. Its social-media guidance also documents positive and negative rumor manipulation and conflicted stock promotion. These sources support the article’s broader taxonomy beyond order-book spoofing.[^investorgov-manipulation][^investorgov-rumors][^investorgov-social-fraud]
CFTC — JPMorgan spoofing and manipulation order
The CFTC’s September 2020 settlement required $920.2 million in monetary relief and described conduct spanning at least eight years and involving hundreds of thousands of spoof orders in precious-metals and U.S. Treasury futures. This source demonstrates that spoofing is not merely a retail-market myth and that institutional-scale enforcement has occurred.[^cftc-jpmorgan]
SEC — Frank M. Cerisano Jr., August 2026
The SEC’s settled action alleged a stock-spoofing sequence involving non-bona fide orders, artificial price movement, opposite-side executions through another brokerage account and rapid cancellation of the spoof orders. The release reports approximately $1.116 million in ill-gotten gains.[^sec-cerisano]
SEC — Harsh V. Patel, April 2026
The SEC complaint alleges a repeated stock-manipulation sequence using many small-lot market buys, non-bona fide buy limit orders, larger sales and cancellation of the buy limits. The SEC describes the conduct as alleged and says it occurred on more than a thousand occasions across hundreds of stocks.[^sec-patel]
FINRA — Social Media “Investment Group” Imposter Scams
FINRA’s December 2025 alert says fraudulent groups can guide victims into low-priced, low-volume exchange-listed stocks and direct the timing, price and quantity of purchases, “essentially leading the investors to unwittingly manipulate” prices upward. This source supports the article’s claim that real victim buying can become part of a ramp-and-dump mechanism.[^finra-investment-groups]
Shang, Serra, Garcia and Mallory — U.S. agricultural futures iceberg research
The 2021 Agricultural Economics paper studies iceberg orders in U.S. corn and live-cattle futures. It finds economically meaningful iceberg activity and reports evidence that hidden-limit orders can improve market quality in the markets studied. It is a critical counterweight to the claim that iceberg activity is inherently abusive.[^shang-iceberg-2021]
Lajbcygier et al. — Icebergs used by information and liquidity traders
The 2025 Journal of Financial Research study states that “icebergs appeal both to information and liquidity traders.” It finds non-aggressive iceberg orders can support liquidity provision, especially in smaller illiquid stocks. The study supports the article’s distinction between hidden liquidity and deceptive order entry.[^lajbcygier-iceberg-2025]
Notes
[^cme-volume]: CME Group, “What Is Volume?,” Introduction to Futures, accessed August 31, 2026, https://www.cmegroup.com/education/courses/introduction-to-futures/what-is-volume .
[^tradingview-volume]: TradingView, “Volume Profile Indicators: Basic Concepts,” accessed August 31, 2026, https://www.tradingview.com/support/solutions/43000502040-volume-profile-indicators-basic-concepts/ .
[^cme-displayed]: CME Group, “iLink Enhancements for Location ID and Displayed Quantity,” Electronic Trading Notice, August 31, 2020, accessed August 31, 2026, https://www.cmegroup.com/notices/electronic-trading/2020/08/20200831.html .
[^nasdaq-reserve]: Nasdaq Trader, “Equity Technical Update #2023-7: Nasdaq Updates Specifications for Non-Displayed Reserve Orders,” 2023, accessed August 31, 2026, https://www.nasdaqtrader.com/TraderNews.aspx?id=ETU2023-7 .
[^cftc-spoofing-guidance]: U.S. Commodity Futures Trading Commission, “Antidisruptive Practices Authority,” final interpretive guidance and policy statement, Federal Register release 2013-12365, May 28, 2013, accessed August 31, 2026, https://www.cftc.gov/LawRegulation/FederalRegister/FinalRules/2013-12365.html .
[^cme-rule-575]: CME Group, “Disruptive Practices Prohibited — General Information,” Rule 575 education, accessed August 31, 2026, https://www.cmegroup.com/education/courses/futures-trading-mechanics-and-regulation/disruptive-practices-prohibited-general-information .
[^finra-2026]: Financial Industry Regulatory Authority, “Manipulative Trading,” 2026 FINRA Annual Regulatory Oversight Report, accessed August 31, 2026, https://www.finra.org/rules-guidance/guidance/reports/2026-finra-annual-regulatory-oversight-report/manipulative-trading .
[^sec-reg-nms-2026]: U.S. Securities and Exchange Commission, The Trade-Through Rule and Locked and Crossed Markets Provisions of Regulation NMS, Release No. 34-105655; File No. S7-2026-20, proposed rule, June 11, 2026, pp. 12–13, accessed August 31, 2026, https://www.sec.gov/files/rules/proposed/2026/34-105655.pdf . Proposal landing page: https://www.sec.gov/rules-regulations/2026/06/s7-2026-20 .
[^cftc-jpmorgan]: U.S. Commodity Futures Trading Commission, “CFTC Orders JPMorgan to Pay Record $920 Million for Spoofing and Manipulation,” Release No. 8260-20, September 29, 2020, accessed August 31, 2026, https://www.cftc.gov/PressRoom/PressReleases/8260-20 .
[^sec-cerisano]: U.S. Securities and Exchange Commission, “Frank M. Cerisano Jr.,” Litigation Release No. 26606, August 10, 2026, accessed August 31, 2026, https://www.sec.gov/enforcement-litigation/litigation-releases/lr-26606 .
[^sec-patel]: U.S. Securities and Exchange Commission, “Harsh V. Patel,” Litigation Release No. 26532, April 20, 2026, accessed August 31, 2026, https://www.sec.gov/enforcement-litigation/litigation-releases/lr-26532 .
[^finra-investment-groups]: Financial Industry Regulatory Authority, “Investor Alert: Social Media ‘Investment Group’ Imposter Scams Continue to Rise,” December 9, 2025, accessed August 31, 2026, https://www.finra.org/investors/insights/investment-group-imposter-scams .
[^cme-open-interest]: CME Group, “Open Interest,” Introduction to Futures, accessed August 31, 2026, https://www.cmegroup.com/education/lessons/open-interest .
[^shang-iceberg-2021]: Quanbiao Shang, Teresa Serra, Philip Garcia, and Mindy Mallory, “Looking Under the Surface: An Analysis of Iceberg Orders in the U.S. Agricultural Futures Markets,” Agricultural Economics 52, no. 4 (2021): 679–699, https://onlinelibrary.wiley.com/doi/10.1111/agec.12642 .
[^lajbcygier-iceberg-2025]: Paul Lajbcygier et al., “Who Can See the Iceberg’s Peak? How Icebergs Are Used by Information and Liquidity Traders,” Journal of Financial Research (first published online 2024; issue publication 2025), https://doi.org/10.1111/jfir.12414 .
[^finra-trf]: Financial Industry Regulatory Authority, “Trade Reporting Facility (TRF),” accessed August 31, 2026, https://www.finra.org/filing-reporting/trade-reporting-facility-trf .
[^cme-submitting-order]: CME Group, “Submitting a Futures Order,” accessed August 31, 2026, https://www.cmegroup.com/education/courses/things-to-know-before-trading-cme-futures/submitting-a-futures-order .
[^finra-potential-manipulation]: Financial Industry Regulatory Authority, “Potential Manipulation Report,” Cross-Market Equities Supervision, accessed August 31, 2026, https://www.finra.org/compliance-tools/report-center/cross-market-equities-supervision/potential-manipulation-report .
[^finra-momentum]: Financial Industry Regulatory Authority, “Manipulative Trading,” 2024 FINRA Annual Regulatory Oversight Report, accessed August 31, 2026, https://www.finra.org/rules-guidance/guidance/reports/2024-finra-annual-regulatory-oversight-report/manipulative-trading ; see also FINRA, “2012 Regulatory and Examination Priorities Letter,” https://www.finra.org/rules-guidance/communications-firms/2012-regulatory-and-examination-priorities-letter .
[^uscode-78i]: U.S. House of Representatives, Office of the Law Revision Counsel, “15 U.S.C. § 78i — Manipulation of Security Prices,” text in effect in 2026, accessed August 31, 2026, https://uscode.house.gov/view.xhtml?req=%28title%3A15+section%3A78i+edition%3Aprelim%29 .
[^cftc-glossary-manipulation]: U.S. Commodity Futures Trading Commission, “Futures Glossary,” entries for “Manipulation,” “Corner,” and “Squeeze,” accessed August 31, 2026, https://www.cftc.gov/LearnAndProtect/AdvisoriesAndArticles/CFTCGlossary/index.htm .
[^cftc-market-surveillance]: U.S. Commodity Futures Trading Commission, “CFTC Market Surveillance Program,” accessed August 31, 2026, https://www.cftc.gov/IndustryOversight/MarketSurveillance/CFTCMarketSurveillanceProgram/index.htm .
[^investorgov-manipulation]: U.S. Securities and Exchange Commission, Investor.gov, “Market Manipulation,” accessed August 31, 2026, https://www.investor.gov/introduction-investing/investing-basics/glossary/market-manipulation .
[^investorgov-rumors]: U.S. Securities and Exchange Commission, Investor.gov, “Updated Investor Alert: Social Media and Investing — Stock Rumors,” accessed August 31, 2026, https://www.investor.gov/introduction-investing/general-resources/news-alerts/alerts-bulletins/investor-alerts/updated-1 .
[^investorgov-social-fraud]: U.S. Securities and Exchange Commission, Investor.gov, “Social Media and Investment Fraud — Investor Alert,” accessed August 31, 2026, https://www.investor.gov/introduction-investing/general-resources/news-alerts/alerts-bulletins/investor-alerts/social-media-and-investment-fraud-investor-alert .
[^cme-wash]: CME Group, “FAQ Related to Rule 534 (‘Wash Trades Prohibited’),” Market Regulation Advisory Notice, accessed August 31, 2026, https://www.cmegroup.com/tools-information/lookups/advisories/market-regulation/CMEGroupRA0913-5.html .
[^sec-lek]: U.S. Securities and Exchange Commission, “Lek Securities Corporation, et al.: Second Circuit Affirms Judgment for SEC in Layering, Manipulative Trading Case,” Litigation Release No. 25427, June 17, 2022, accessed August 31, 2026, https://www.sec.gov/enforcement-litigation/litigation-releases/lr-25427 .
[^finra-pump-dump]: Financial Industry Regulatory Authority, “Avoiding Pump-and-Dump Scams,” April 24, 2025, accessed August 31, 2026, https://www.finra.org/investors/insights/pump-and-dump-scams .
Selected Bibliography
CME Group. “Disruptive Practices Prohibited — General Information.” Accessed August 31, 2026. https://www.cmegroup.com/education/courses/futures-trading-mechanics-and-regulation/disruptive-practices-prohibited-general-information .
CME Group. “iLink Enhancements for Location ID and Displayed Quantity.” Electronic Trading Notice. August 31, 2020. https://www.cmegroup.com/notices/electronic-trading/2020/08/20200831.html .
CME Group. “What Is Volume?” Introduction to Futures. Accessed August 31, 2026. https://www.cmegroup.com/education/courses/introduction-to-futures/what-is-volume .
U.S. Commodity Futures Trading Commission. “CFTC Market Surveillance Program.” Accessed August 31, 2026. https://www.cftc.gov/IndustryOversight/MarketSurveillance/CFTCMarketSurveillanceProgram/index.htm .
U.S. Commodity Futures Trading Commission. “Futures Glossary.” Accessed August 31, 2026. https://www.cftc.gov/LearnAndProtect/AdvisoriesAndArticles/CFTCGlossary/index.htm .
U.S. Securities and Exchange Commission. Investor.gov. “Market Manipulation.” Accessed August 31, 2026. https://www.investor.gov/introduction-investing/investing-basics/glossary/market-manipulation .
Financial Industry Regulatory Authority. “Avoiding Pump-and-Dump Scams.” April 24, 2025. https://www.finra.org/investors/insights/pump-and-dump-scams .
Financial Industry Regulatory Authority. “Investor Alert: Social Media ‘Investment Group’ Imposter Scams Continue to Rise.” December 9, 2025. https://www.finra.org/investors/insights/investment-group-imposter-scams .
Financial Industry Regulatory Authority. “Manipulative Trading.” 2026 FINRA Annual Regulatory Oversight Report. https://www.finra.org/rules-guidance/guidance/reports/2026-finra-annual-regulatory-oversight-report/manipulative-trading .
Financial Industry Regulatory Authority. “Potential Manipulation Report.” Cross-Market Equities Supervision. https://www.finra.org/compliance-tools/report-center/cross-market-equities-supervision/potential-manipulation-report .
Lajbcygier, Paul, et al. “Who Can See the Iceberg’s Peak? How Icebergs Are Used by Information and Liquidity Traders.” Journal of Financial Research. https://doi.org/10.1111/jfir.12414 .
Nasdaq Trader. “Equity Technical Update #2023-7: Nasdaq Updates Specifications for Non-Displayed Reserve Orders.” https://www.nasdaqtrader.com/TraderNews.aspx?id=ETU2023-7 .
Shang, Quanbiao, Teresa Serra, Philip Garcia, and Mindy Mallory. “Looking Under the Surface: An Analysis of Iceberg Orders in the U.S. Agricultural Futures Markets.” Agricultural Economics 52, no. 4 (2021): 679–699. https://onlinelibrary.wiley.com/doi/10.1111/agec.12642 .
TradingView. “Volume Profile Indicators: Basic Concepts.” Accessed August 31, 2026. https://www.tradingview.com/support/solutions/43000502040-volume-profile-indicators-basic-concepts/ .
U.S. Commodity Futures Trading Commission. “Antidisruptive Practices Authority.” Federal Register Release 2013-12365. May 28, 2013. https://www.cftc.gov/LawRegulation/FederalRegister/FinalRules/2013-12365.html .
U.S. Commodity Futures Trading Commission. “CFTC Orders JPMorgan to Pay Record $920 Million for Spoofing and Manipulation.” Release No. 8260-20. September 29, 2020. https://www.cftc.gov/PressRoom/PressReleases/8260-20 .
U.S. Securities and Exchange Commission. “Frank M. Cerisano Jr.” Litigation Release No. 26606. August 10, 2026. https://www.sec.gov/enforcement-litigation/litigation-releases/lr-26606 .
U.S. Securities and Exchange Commission. “Harsh V. Patel.” Litigation Release No. 26532. April 20, 2026. https://www.sec.gov/enforcement-litigation/litigation-releases/lr-26532 .
U.S. Securities and Exchange Commission. “Lek Securities Corporation, et al.” Litigation Release No. 25427. June 17, 2022. https://www.sec.gov/enforcement-litigation/litigation-releases/lr-25427 .
U.S. Securities and Exchange Commission. The Trade-Through Rule and Locked and Crossed Markets Provisions of Regulation NMS. Release No. 34-105655; File No. S7-2026-20. Proposed rule. June 11, 2026. https://www.sec.gov/files/rules/proposed/2026/34-105655.pdf .
U.S. House of Representatives, Office of the Law Revision Counsel. “15 U.S.C. § 78i — Manipulation of Security Prices.” https://uscode.house.gov/view.xhtml?req=%28title%3A15+section%3A78i+edition%3Aprelim%29 .
Where this came from
- What Is Volume? — CME Group
- Volume Profile Indicators: Basic Concepts — TradingView
- iLink Enhancements for Location ID and Displayed Quantity — CME Group
- Equity Technical Update #2023-7: Nasdaq Updates Specifications for Non-Displayed Reserve Orders — Nasdaq
- Antidisruptive Practices Authority — U.S. Commodity Futures Trading Commission
- Disruptive Practices Prohibited — General Information — CME Group
- Manipulative Trading — Financial Industry Regulatory Authority
- The Trade-Through Rule and Locked and Crossed Markets Provisions of Regulation NMS — U.S. Securities and Exchange Commission
- CFTC Orders JPMorgan to Pay Record $920 Million for Spoofing and Manipulation — U.S. Commodity Futures Trading Commission
- Frank M. Cerisano Jr. — U.S. Securities and Exchange Commission
- Harsh V. Patel — U.S. Securities and Exchange Commission
- Investor Alert: Social Media ‘Investment Group’ Imposter Scams Continue to Rise — Financial Industry Regulatory Authority
- Open Interest — CME Group
- Looking Under the Surface: An Analysis of Iceberg Orders in the U.S. Agricultural Futures Markets — Agricultural Economics
- Who Can See the Iceberg’s Peak? How Icebergs Are Used by Information and Liquidity Traders — Journal of Financial Research
- Trade Reporting Facility (TRF) — Financial Industry Regulatory Authority
- Submitting a Futures Order — CME Group
- Potential Manipulation Report — Financial Industry Regulatory Authority
- Manipulative Trading — Financial Industry Regulatory Authority
- 15 U.S.C. § 78i — Manipulation of Security Prices — U.S. House of Representatives, Office of the Law Revision Counsel
- Futures Glossary — U.S. Commodity Futures Trading Commission
- CFTC Market Surveillance Program — U.S. Commodity Futures Trading Commission
- Market Manipulation — U.S. Securities and Exchange Commission
- Updated Investor Alert: Social Media and Investing — Stock Rumors — U.S. Securities and Exchange Commission
- Social Media and Investment Fraud — Investor Alert — U.S. Securities and Exchange Commission
- FAQ Related to Rule 534 (‘Wash Trades Prohibited’) — CME Group
- Lek Securities Corporation, et al.: Second Circuit Affirms Judgment for SEC in Layering, Manipulative Trading Case — U.S. Securities and Exchange Commission
- Avoiding Pump-and-Dump Scams — Financial Industry Regulatory Authority
General financial education, not advice about your situation.
This is the plain-text version of the story. Read it with the pictures and formatting.